
Fact Sheet FS1381
As the majority of New Jersey agriculture is devoted to labor-intensive crops, labor costs play a critical role in farm viability. Labor shortages remain a concern for New Jersey farms and are consistently cited as one of the top policy issues by the New Jersey Farm Bureau. As labor costs continue to grow, the financial pressure on New Jersey growers intensifies, adding to the challenges of operating in an already high-cost environment.
This fact sheet examines recent trends in agricultural labor. It examines patterns in farm employment, wage dynamics, and the use of the H-2A guest worker program. This factsheet focuses exclusively on crop production, excluding labor employed in livestock or forestry operations.
Farm Labor Employment
Direct Farm Employment: Workers on a Farm's Payroll
- In the Northeast region (NJ, NY, PA, DE), direct farm employment has been declining since 2016.
- In 2025, farm direct employment remains at its lowest level since 2000.
- In New Jersey, Cumberland County hires the most, followed by Atlantic County and Gloucester County (Figure 1).
- In 2024, New Jersey had 7,948 direct farm employees. (This number includes only workers covered by state unemployment insurance and excludes contract labor and unpaid family workers.)
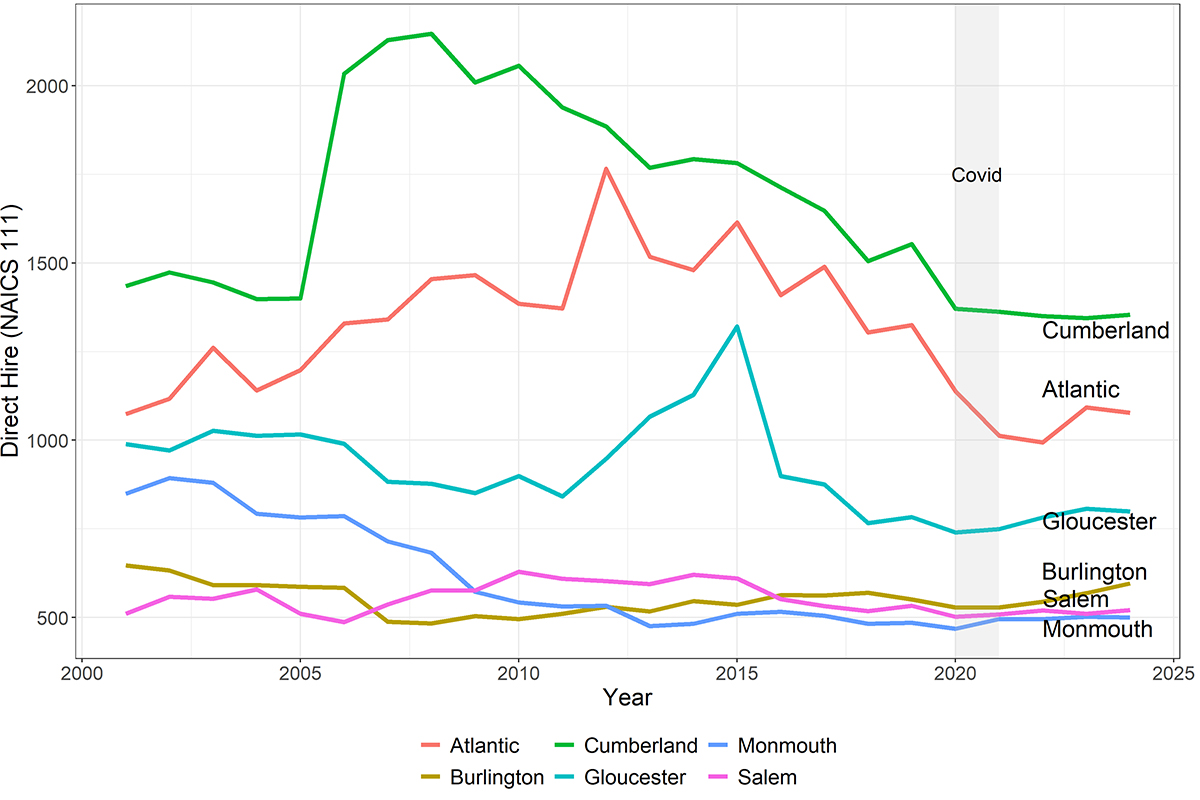
Figure 1: Number of direct hire workers across counties in New Jersey from 2001 to 2024.
These are the six New Jersey counties with the greatest number of full-time agricultural employment.
Data source: Bureau of Labor Statistics, Quarterly Census of Employment and Wages.
Contract Workers: Custom Workers or Third-Party Contractors
- In 2024, 20% of total farm employment in New Jersey was contract workers.
- The number of contract hires has been increasing, as it has become more difficult for farms to recruit workers directly (Figure 2).
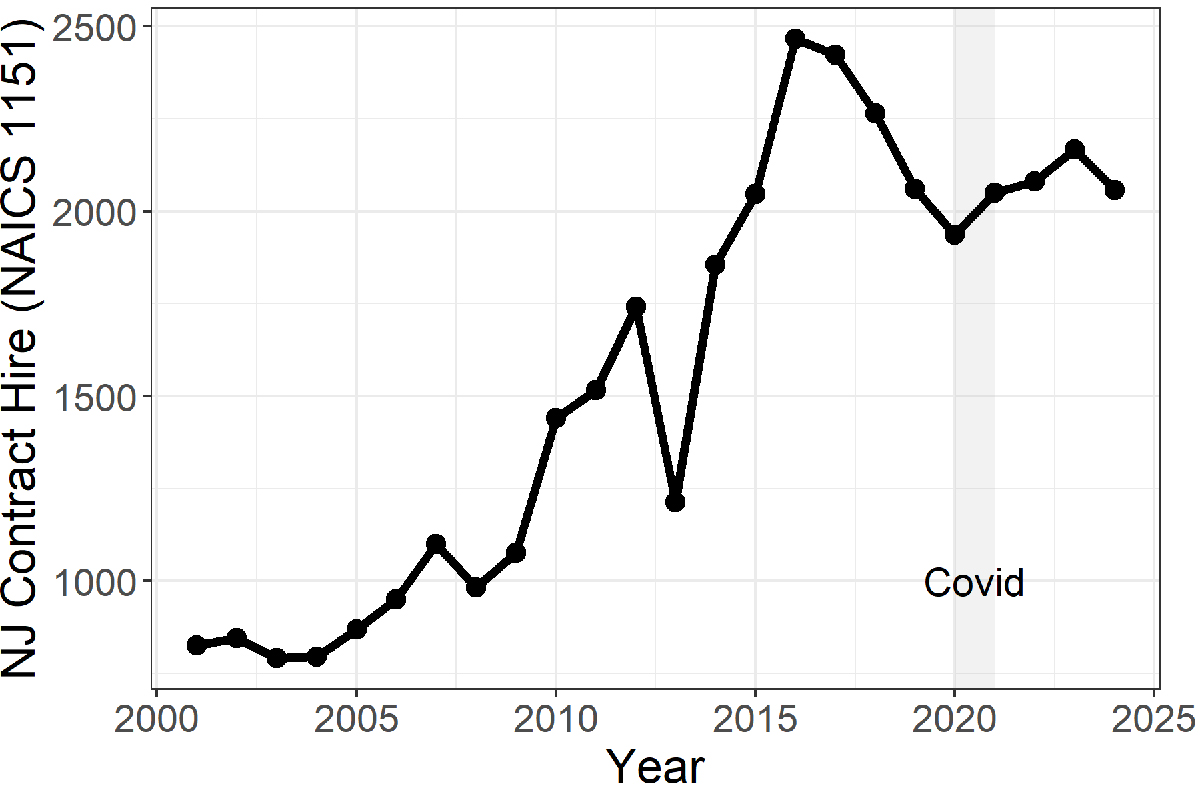
Figure 2: Number of contract-hire workers in New Jersey from 2001 to 2024.
Data source: Bureau of Labor Statistics, Quarterly Census of Employment and Wages.
H-2A Workers1: Foreign Workers on a Seasonal Basis
- The H-2A Temporary Agricultural Workers Program is the primary legal pathway for U.S. farms to hire foreign workers on a seasonal basis.
- In 2025, New Jersey certified more than 2,500 H-2A workers, compared to about 500 in 2008.
- H-2A workers are mostly in the southern part of New Jersey, in Cumberland, Gloucester, and Salem counties (Figure 3).
- H-2A use surged sharply in 2021, most notably in Atlantic County (15 to 252 workers) and Cumberland County (304 to 599) but declined again by 2024 (Figure 4).
1H-2A workers are recorded in a mutually exclusive employment category apart from direct-hire and contract workers.
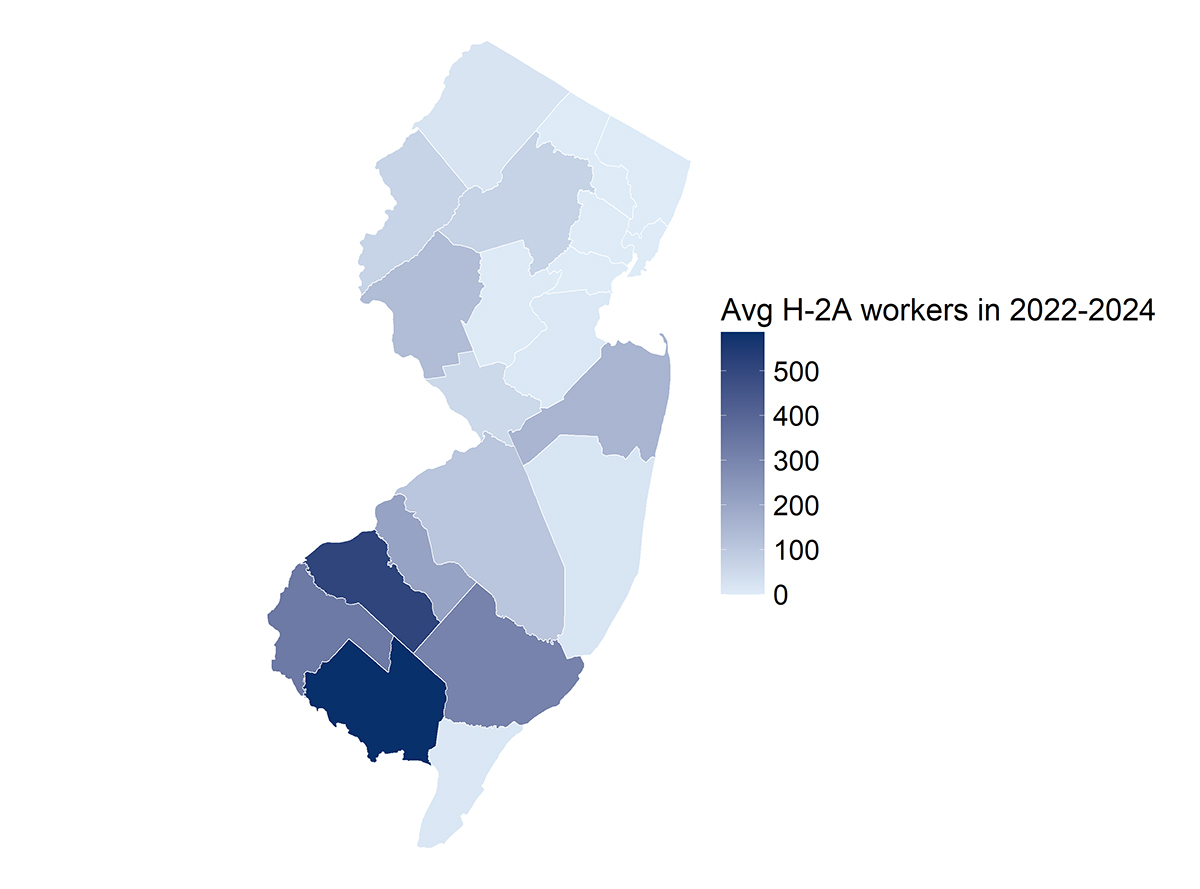
Figure 3: Average annual H-2A workers across New Jersey counties, 2022-2024.
Data source: Department of Labor, Foreign Labor Certification Program Disclosure Data.
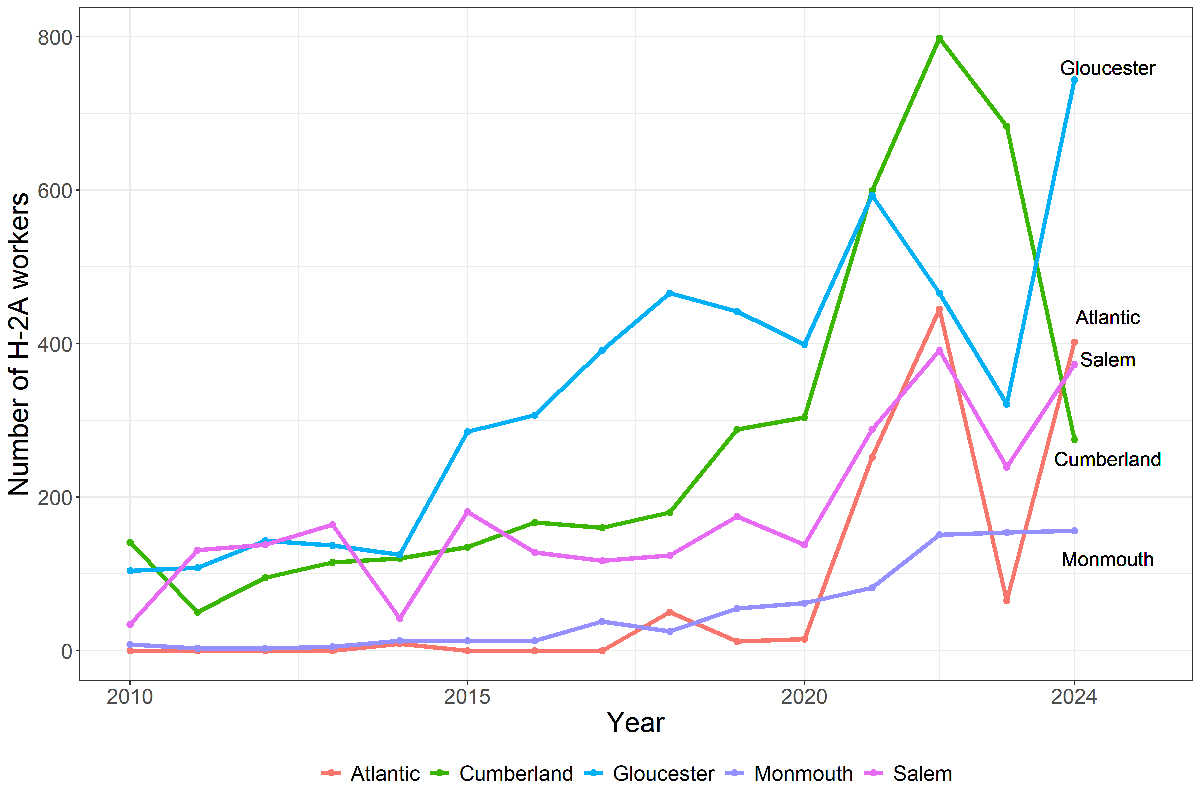
Figure 4: Number of annual H-2A certified workers in New Jersey from 2010 to 2024.
These are the five New Jersey counties with the greatest number of H-2A employment.
Data source: Department of Labor, Foreign Labor Certification Program Disclosure Data.
Wage
- Farm worker wages in New Jersey have been rising rapidly.
- Increase in farmworker pay has outpaced wage growth for all workers statewide.
- Direct-hire farm employees saw an 8% increase between 2019 and 2024 (from $789 to $852 per week), compared to only a 1% increase for all New Jersey workers (from $1,589 to $1,603).
- Between 2023 and 2024, wages for direct hires rose by 1.4%, compared to just 0.5% for all New Jersey employees.
- The increase has been even steeper for contracted agricultural workers, whose average weekly wages surpassed those of direct farm employees in 2016 and have remained higher ever since (Figure 5).
- H2-A wages are typically higher than the minimum wage, because they must comply with the Adverse Effect Wage Rate (AEWR). AEWR is the minimum wage that employers must pay H-2A workers to ensure foreign labor does not undercut U.S. farmworker wages.
- In 2024, the average H2-A wage in New Jersey was 17.68 $/hr.
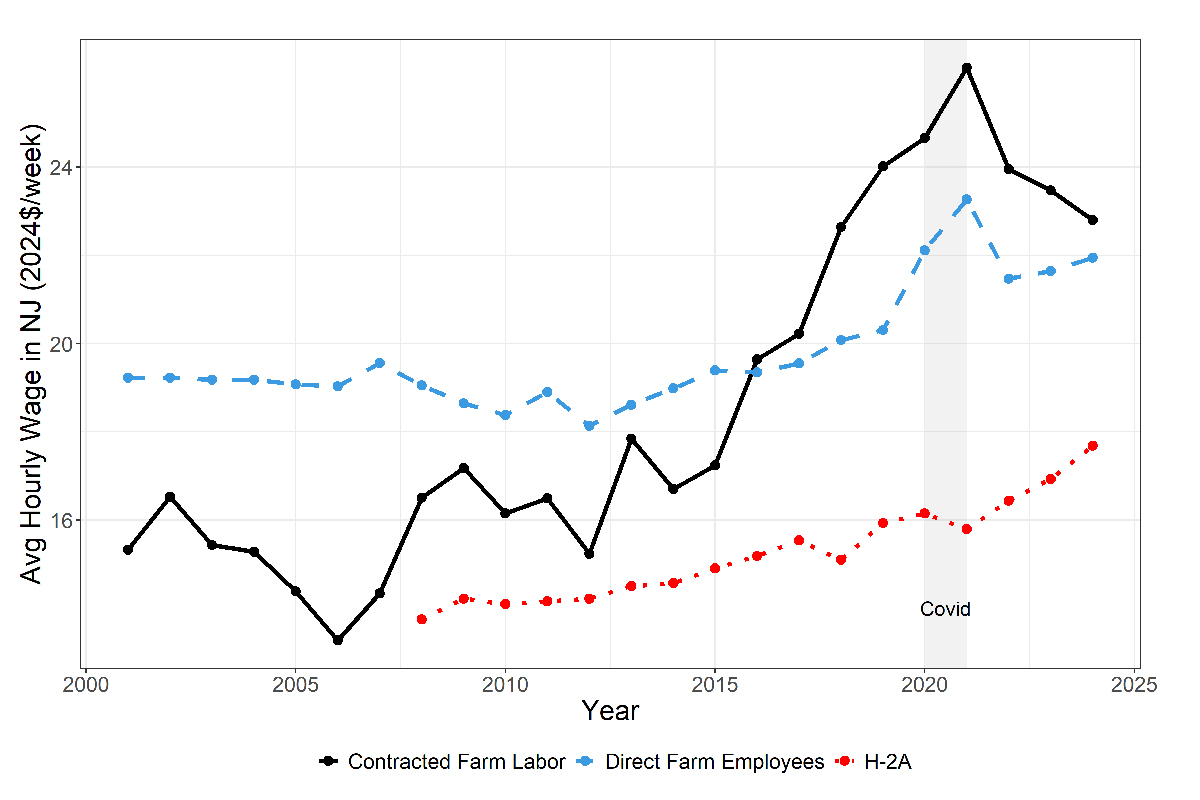
Figure 5: Average hourly wage across labor types in New Jersey.
Data source: Bureau of Labor Statistics, Quarterly Census of Employment and Wages; Department of Labor, Foreign Labor Certification Program Disclosure data.
Conclusion
The upward trends in wage rates and in the employment of contingent workers suggest that the farm labor market in New Jersey has been tightening over time. Persistently rising wages alongside increasing demand for contingent workers indicate growing competition for labor, reinforcing concerns among farmers about hiring challenges and rising labor costs.
Data Used in This Analysis
| Who collects? | Data | Who answers? |
|---|---|---|
| USDA, National Agricultural Statistics Service | Census of Agriculture | Farms (employers) |
| Farm Labor Survey | Farms (employers) Northeast – NJ, NY, PA, DE | |
| Bureau of Labor Statistics | Quarterly Census of Employment and Wages | Unemployment insurance data |
| Occupational Employment and Wage Statistics | Nonfarm employers – labor contracting firm | |
| Department of Labor | Foreign Labor Certification Program Disclosure Data | Employers applying for H2-A certification |
References
December 2025
Copyright © Rutgers, The State University of New Jersey. All rights reserved.
For more information: extension.rutgers.edu.
Cooperating Agencies: Rutgers, The State University of New Jersey, U.S. Department of Agriculture, and Boards of County Commissioners. Rutgers Cooperative Extension, a unit of the Rutgers New Jersey Agricultural Experiment Station, is an equal opportunity program provider and employer.